VST’s simulations are designed to provide students with opportunities to practice designing experiments, collecting data, and analyzing results. They pair seamlessly with VST’s Graph Makers to enhance data-driven learning experiences.
While these simulations aim to be as realistic as possible, they are simplified models intended for educational purposes and do not perfectly replicate real-world scenarios. We encourage users to focus on the concepts and skills they develop through these interactive tools.
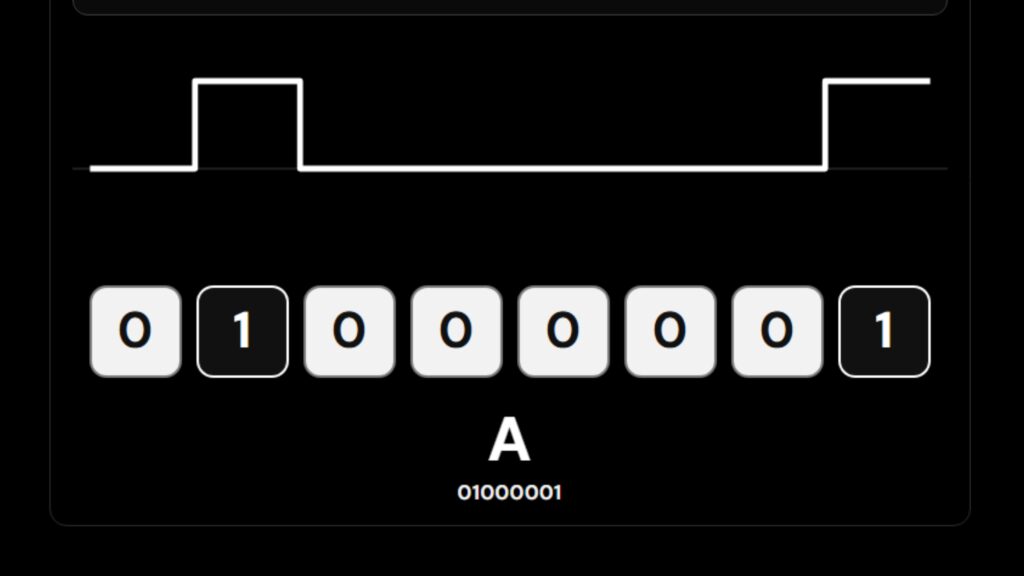
This simulation lets you switch 0s and 1s in an 8-bit code. As the code changes, the digital wave updates above and the symbol the code represents appears below.