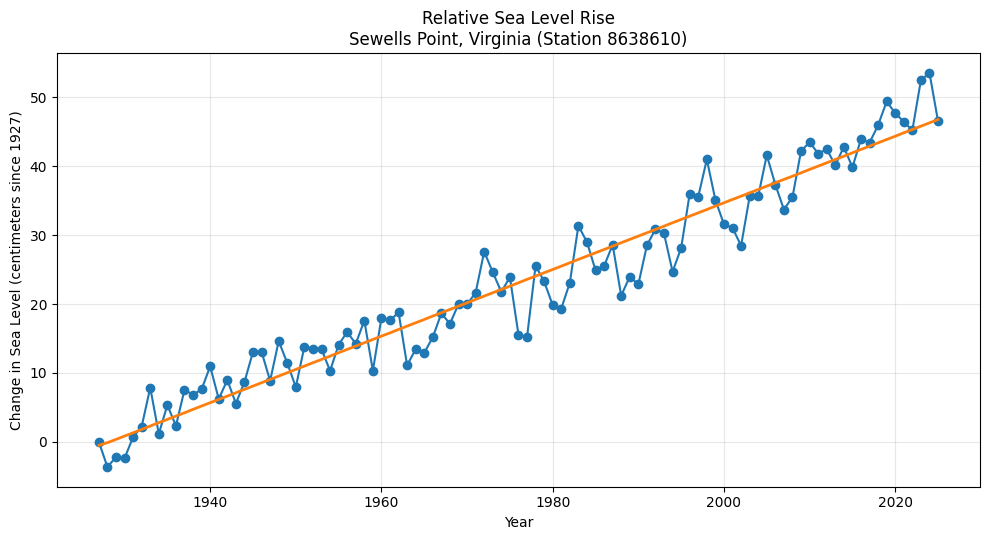
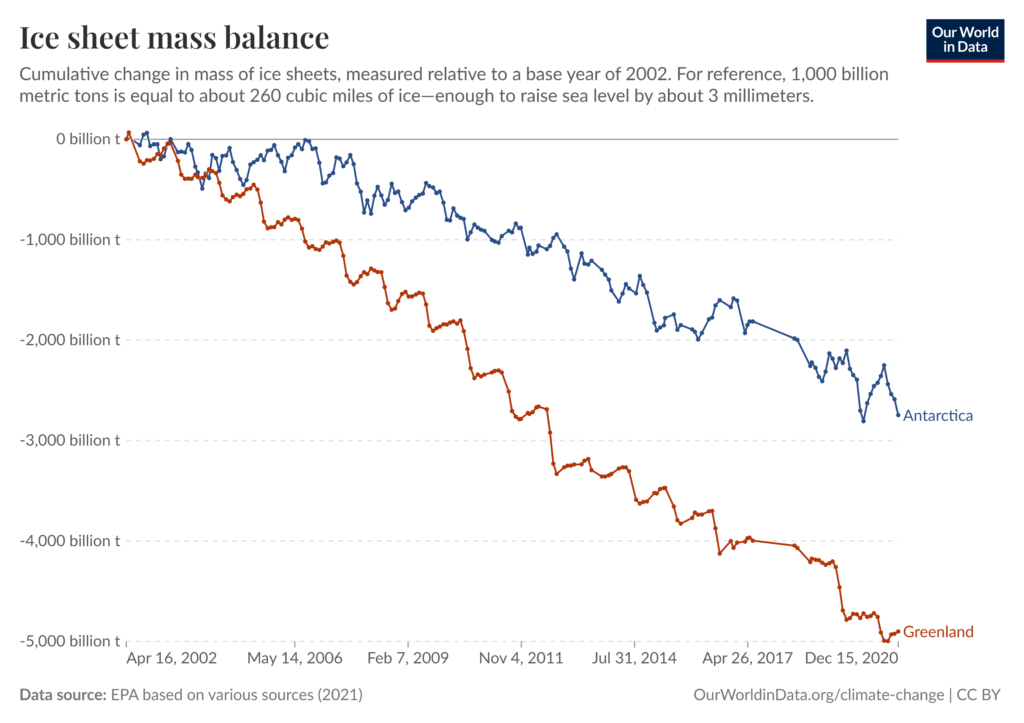
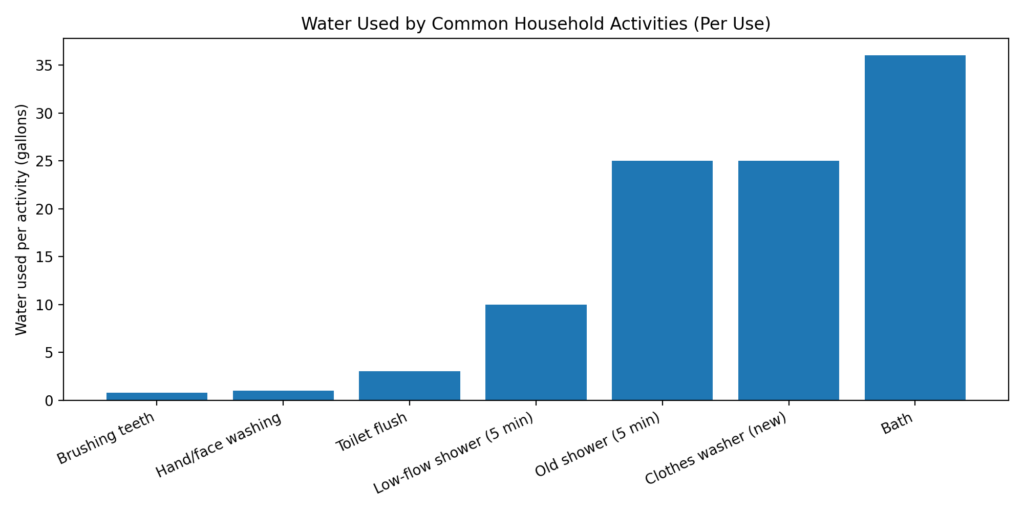
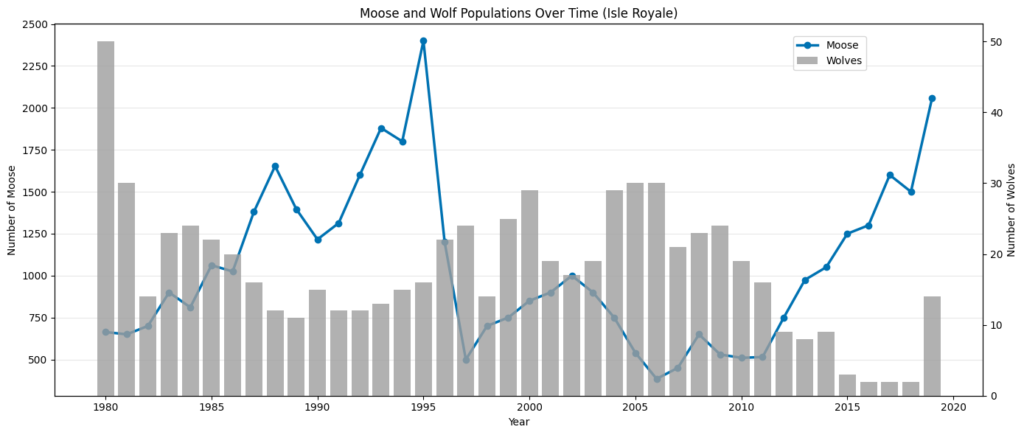
Suggested Use: We recommend completing the activities in order to build students’ understanding and confidence in reading and interpreting graphs.
- Gradual Graph Reveal- The graph is revealed step by step for teacher-led discussion. Students observe the data, make predictions, and discuss what the graph might show before seeing the complete graph.
- Basic Graph Reading- Students answer multiple-choice questions that focus on reading values and identifying information directly from the graph. Auto-graded.
- Interpreting Patterns- Students answer multiple-choice questions that focus on identifying patterns, trends, and relationships in the data. Auto-graded.
- Claim • Evidence • Reasoning (CER)- Students write a short scientific explanation using evidence from the graph. A student CER guide and grading rubric are provided below.
Select any activity to open it in a new tab. From the activity page, you can copy the link or use the Embed button to add the activity directly to your LMS.