-
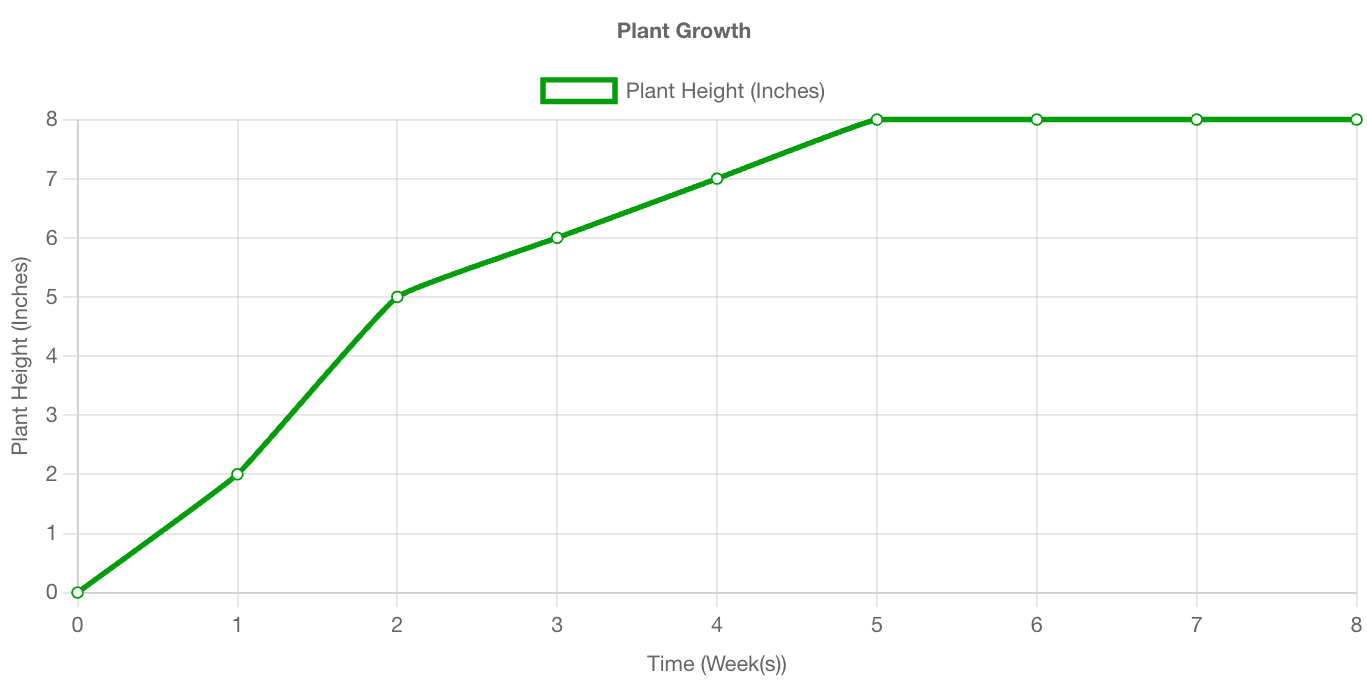
Line Graph Maker
Use when you want to show how one variable changes over time or across ordered intervals.
Open Tool -

Line Graph Maker
(Multiple Sets)Use when you want to compare how two or more data sets change over the same time or trials.
Open Tool -
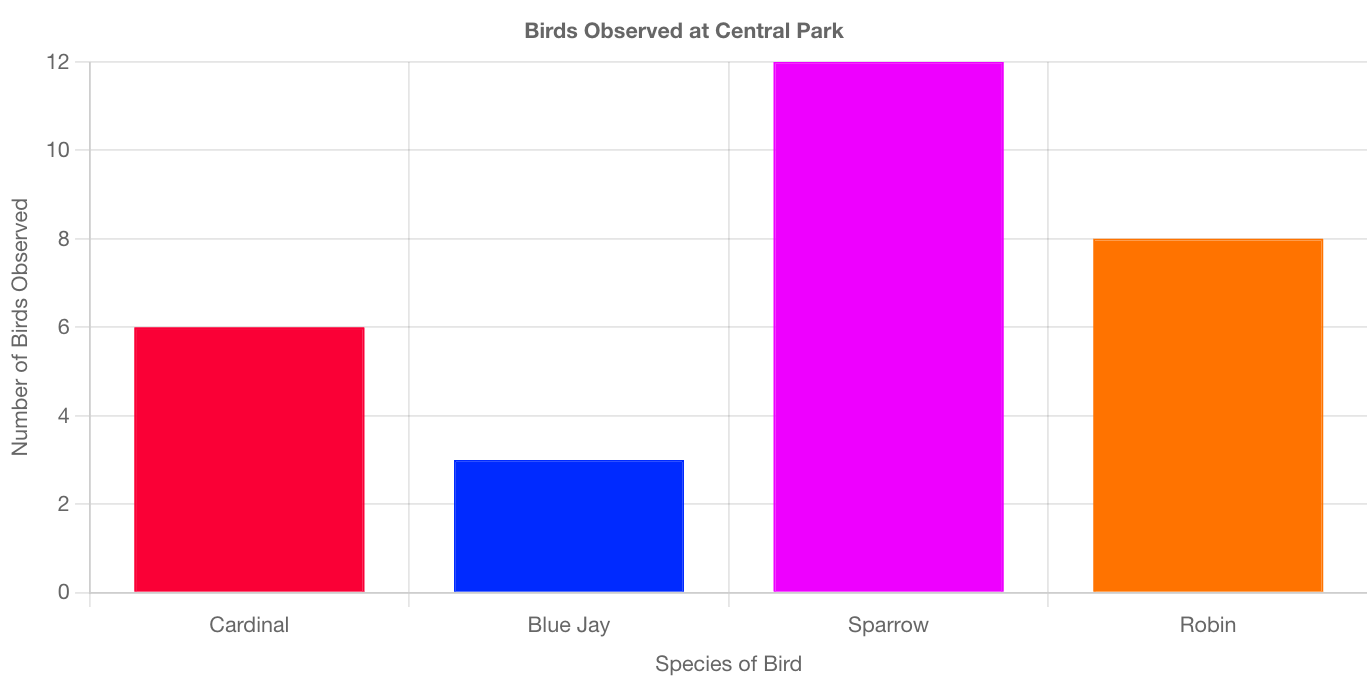
Bar Graph Maker
Use when you want to compare values across categories.
Open Tool -

Bar Graph Maker
(Multiple Sets)Use when you want to compare the same categories across two or more groups.
Open Tool -
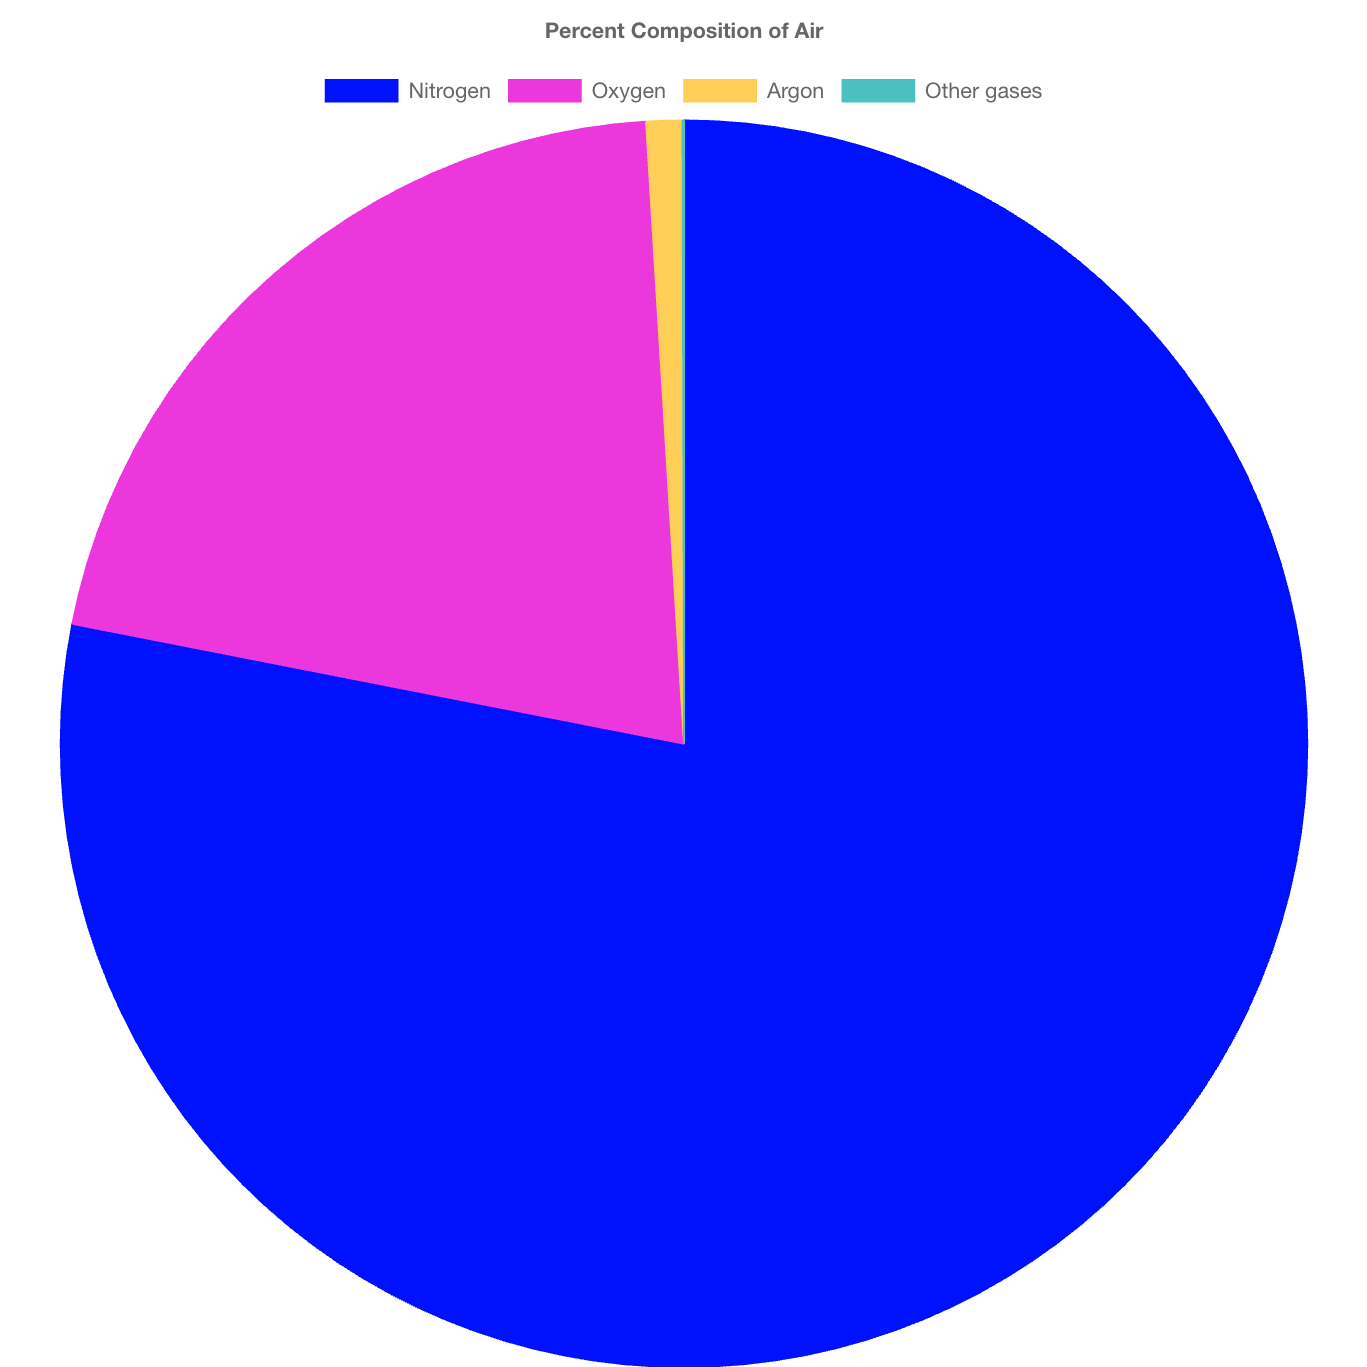
Pie Chart Maker
Use when you want to show how a whole is divided into parts that add up to 100%.
Open Tool -
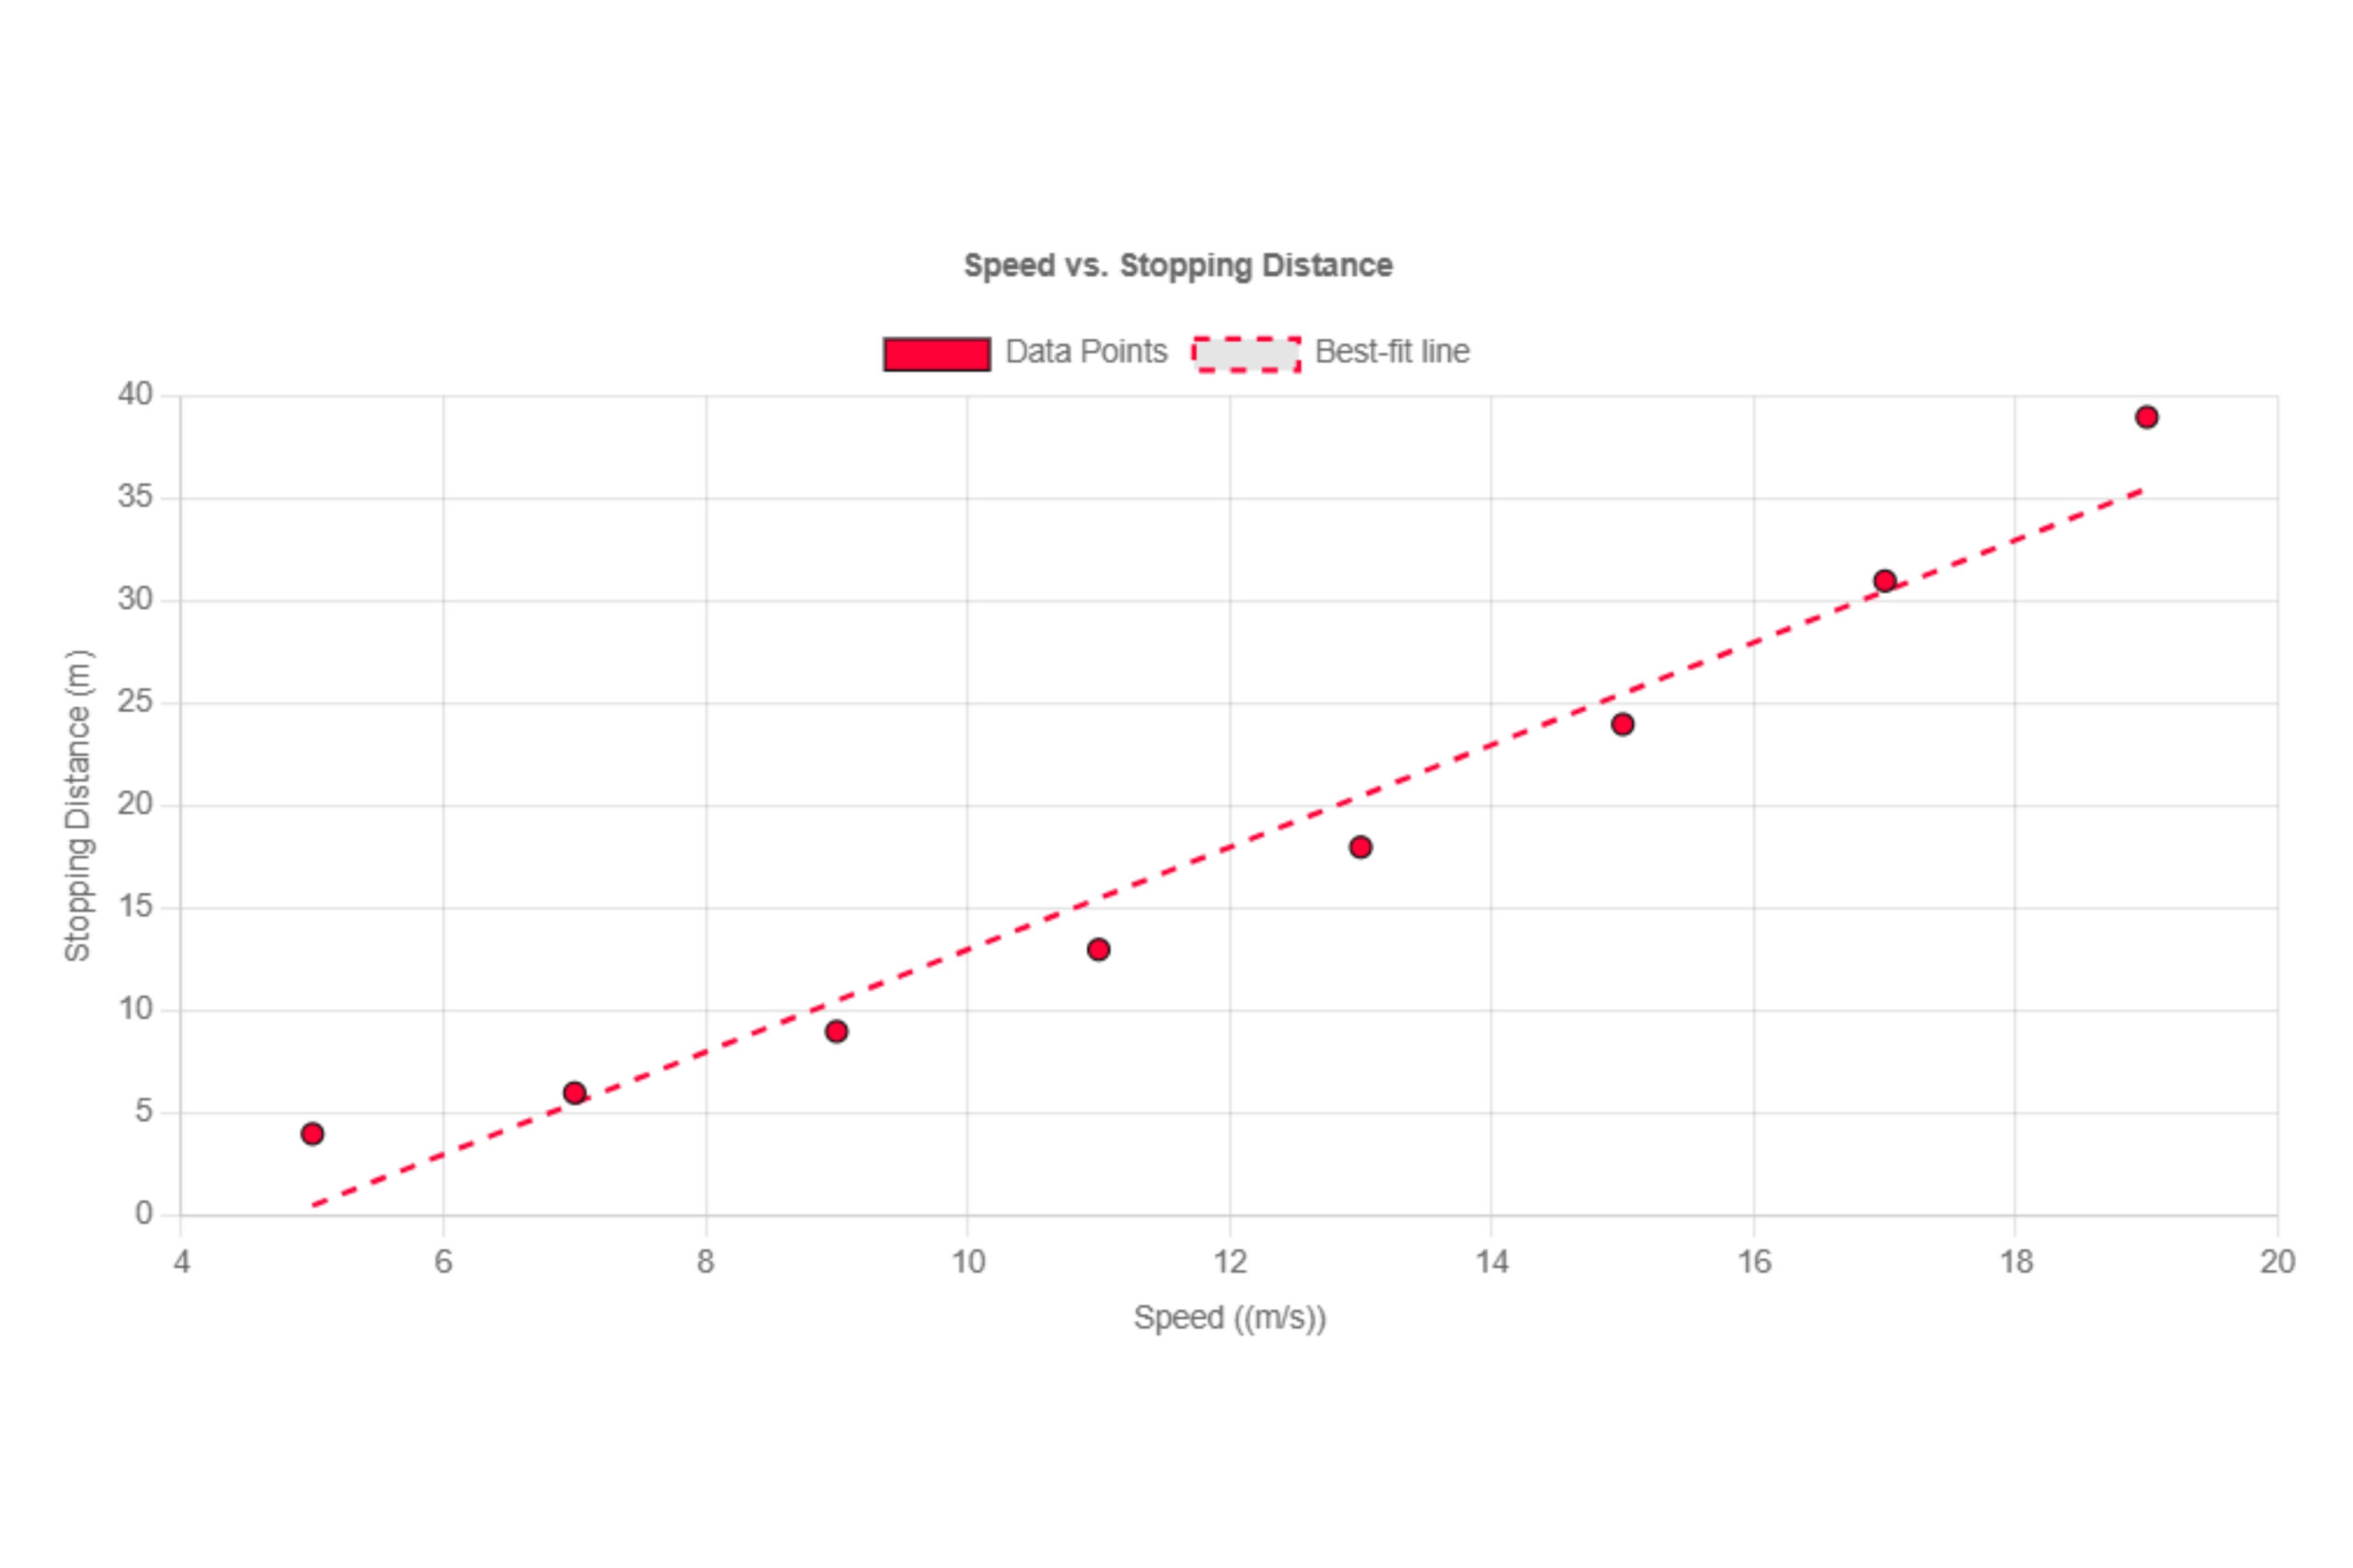
Scatter Plot Maker
Use when each point represents one measurement and you want to see if two variables are related.
Open Tool