Background Information
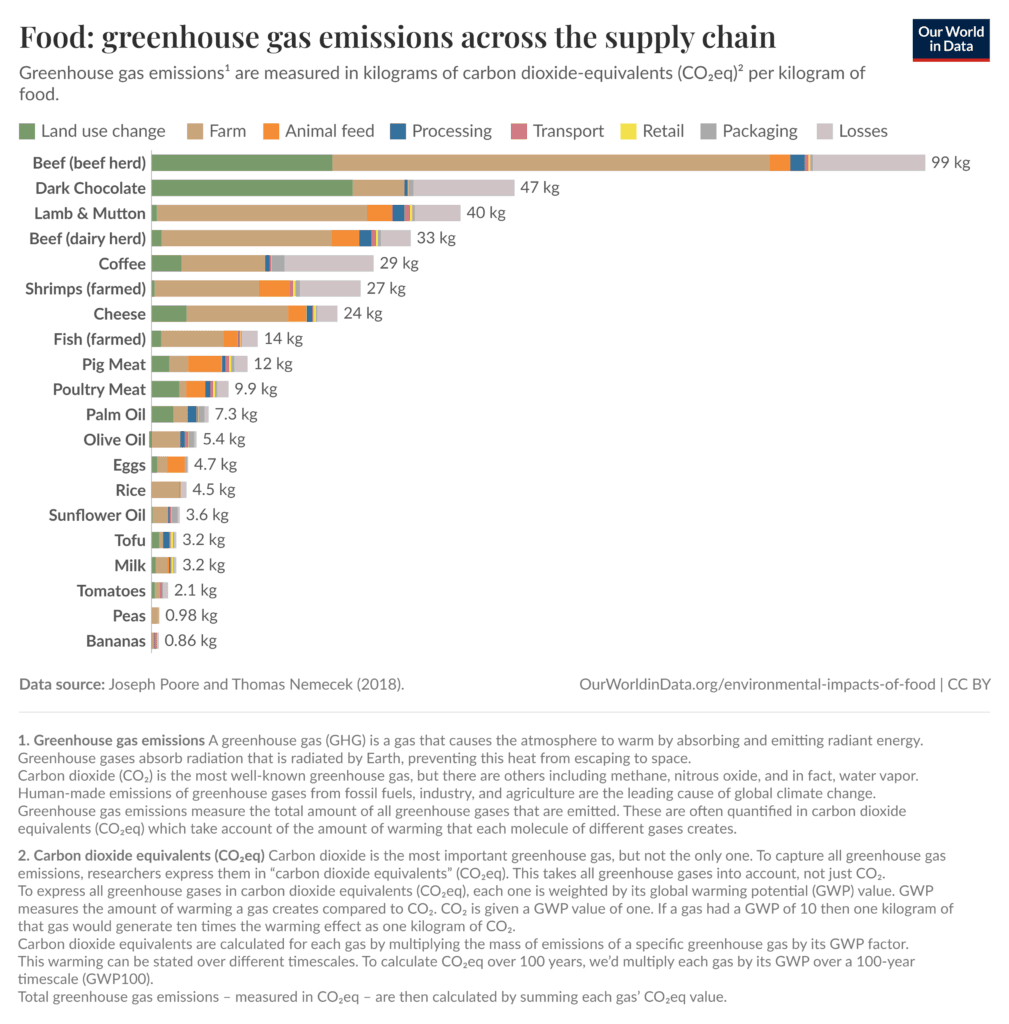
Different foods produce different amounts of greenhouse gases as they are grown, processed, and transported. Animal-based foods often require more resources because animals must be fed, housed, and cared for over time. Some animals, such as cows and sheep, also release methane gas during digestion, which is a powerful greenhouse gas. In addition, clearing land to raise animals or grow animal feed can increase greenhouse gas emissions. Plant-based foods usually require fewer resources and produce fewer greenhouse gases because they grow directly from plants and do not require animal feed.
CER Question
Question:
Based on the graph, which type of food generally produces more greenhouse gas emissions per kilogram: animal-based foods or plant-based foods?
How to Answer Using CER:
Claim
Write one clear sentence that answers the question.
Evidence
Use specific data from the graph to support your claim.
Include the names of at least two foods and their approximate greenhouse gas emissions values.
Reasoning
Explain why your evidence supports your claim.
Connect the type of food to information shown in the graph, such as methane production, land use change, or animal feed.
Additional Questions
Which food shown on the graph has the highest greenhouse gas emissions per kilogram?
Which food shown on the graph has the lowest greenhouse gas emissions per kilogram?
How do greenhouse gas emissions from animal-based foods compare to plant-based foods overall? What pattern do you notice?
For a food with high emissions, which part of the supply chain (such as farming, land use change, or transport) contributes the most to its total emissions?
Based on the graph, what is one change a person could make to reduce the greenhouse gas emissions from their food choices?
Embed This Graph
Copy and paste this code into your LMS or website (Canvas, Google Sites, etc.).