Virtual Science Teachers · Science Skills
Data Tables & Graph Basics
Ten short, guided activities that take students from reading a data table to building, reading, and fixing graphs, with real science data in every one.
- 10 interactive activities
- 10 matching worksheets
- Grades 6–8
- About 10–15 minutes each

How the set builds skills
Use the activities in order as a mini-unit, or pick the one skill your students need. Each activity is one screen of guided practice, and each has a printable worksheet that matches it.
- Build graphs
Make it
Turn data tables into bar graphs, line graphs, and scatter plots with clear labels and scales. Activities 1, 2, 5, 6, and 8.
- Read graphs
Read it
Pull values, compare bars, and describe trends like increases and leveling off. Activities 3 and 7.
- Think like a scientist
Question it
Identify variables, pick the right graph type, and catch common graph mistakes. Activities 4, 9, and 10.
The activities and worksheets
-
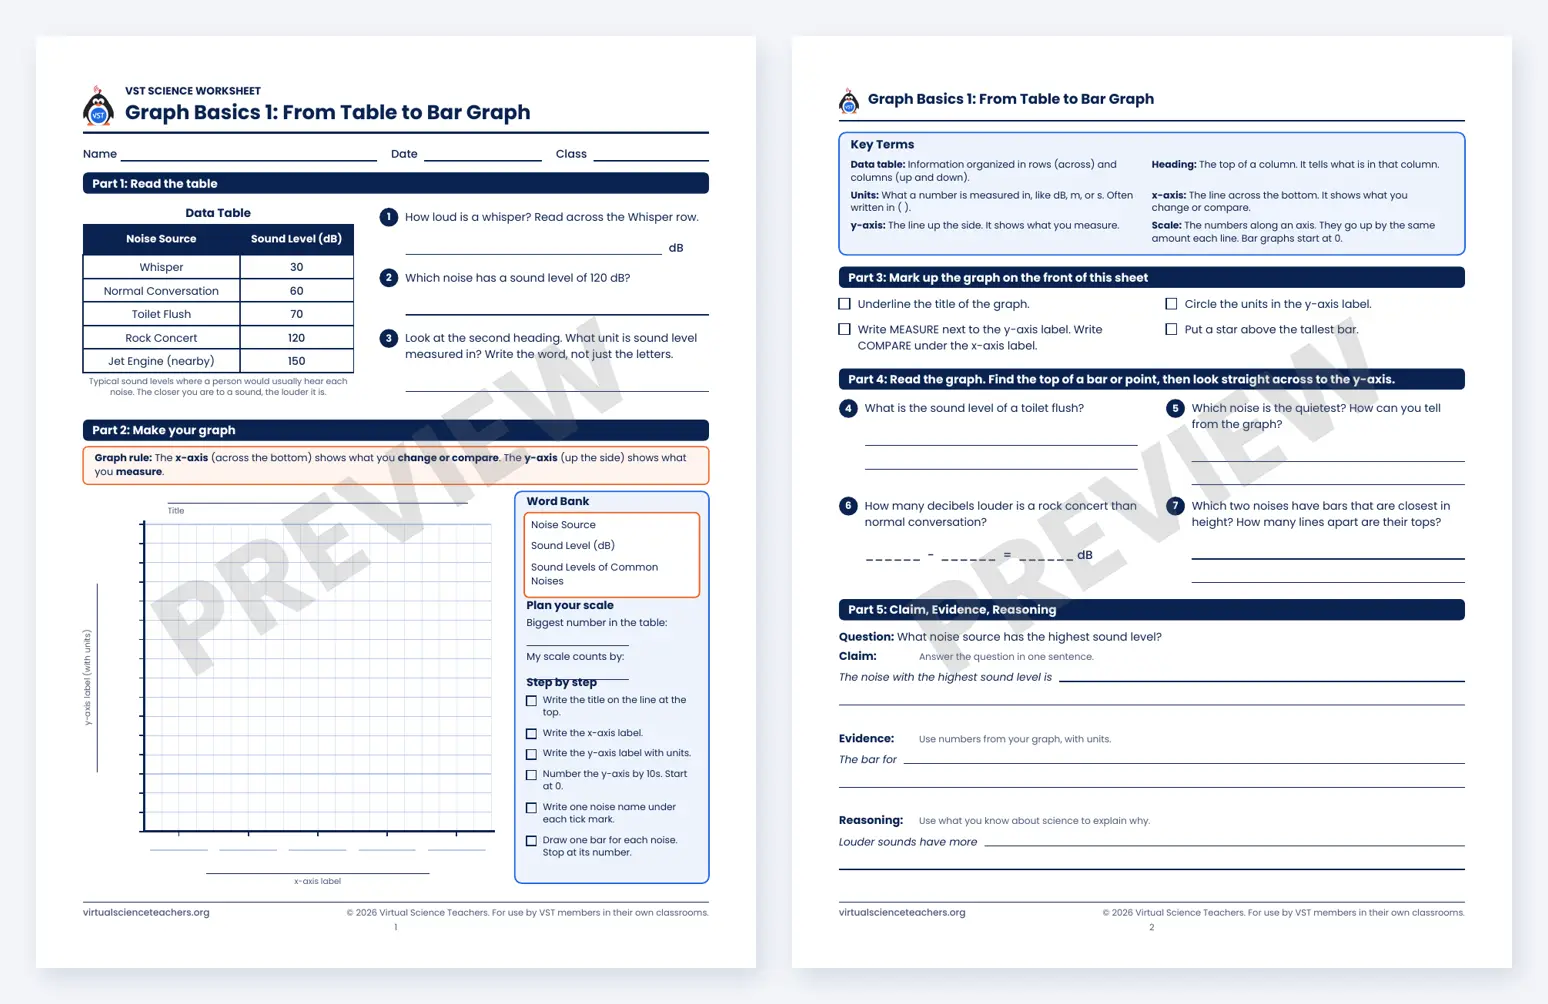
Activity 1 · Make a bar graph
From Table to Bar Graph
Read a data table, label axes, choose a scale, and draw bars.
Data: Sound levels
 Preview worksheet 1 (opens in a new tab)
Download worksheet 1 (opens in a new tab)
Worksheet included with VST Teacher Membership
-

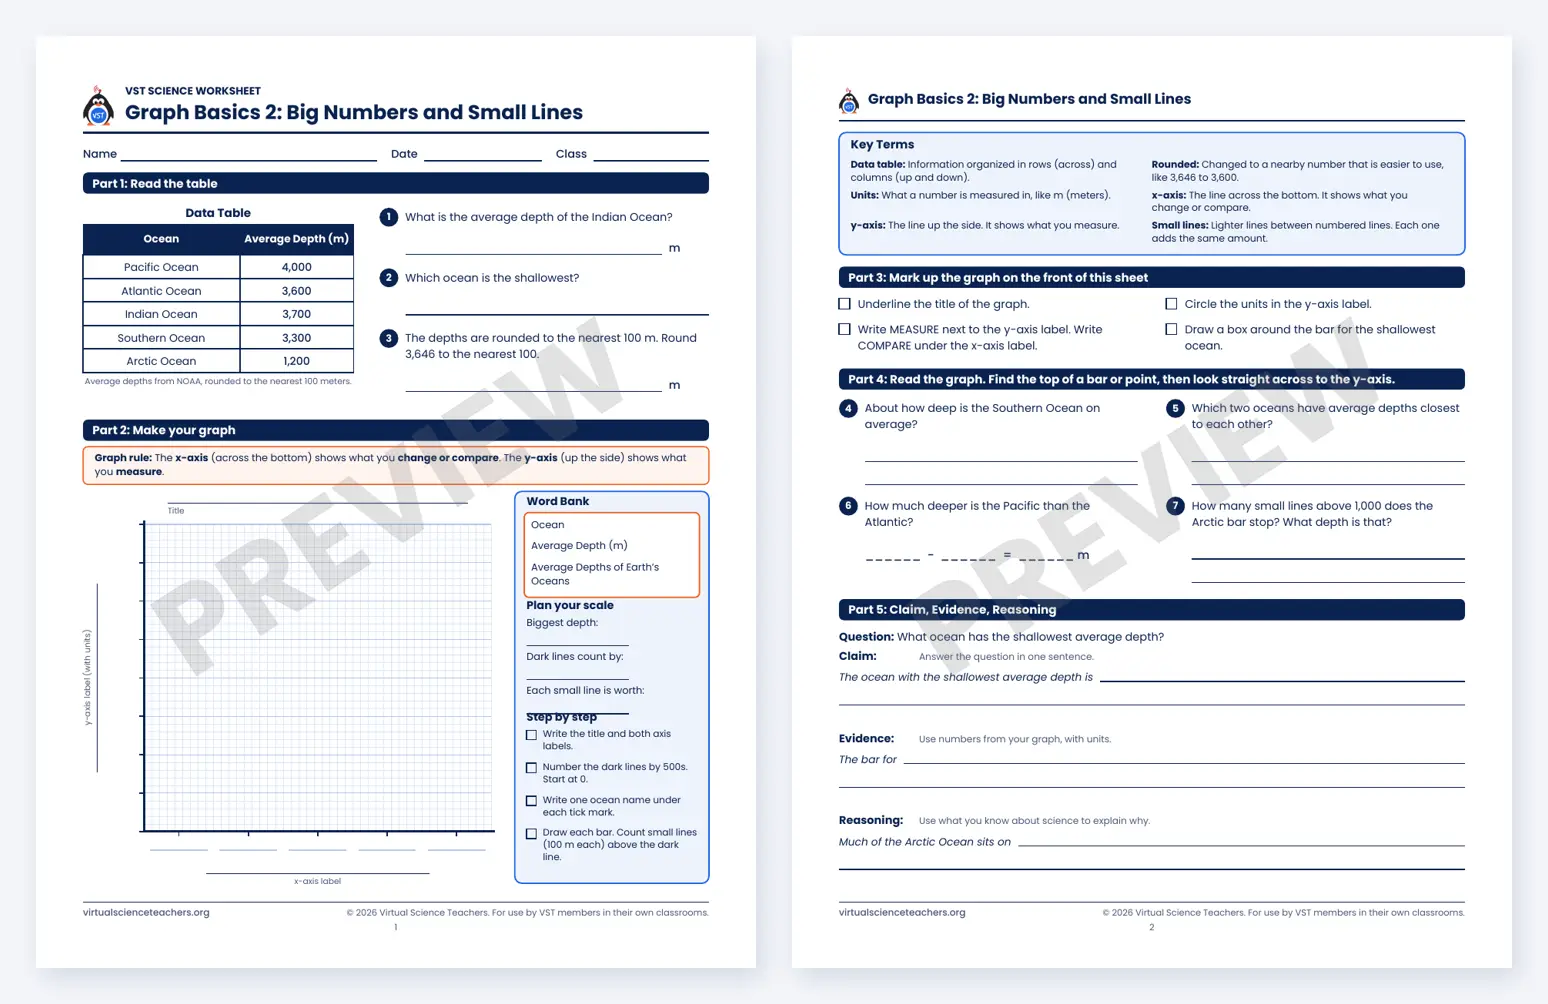
Activity 2 · Choose a scale
Big Numbers and Small Lines
Count by 500s and use small lines to place values between numbered lines.
Data: Ocean depths
 Preview worksheet 2 (opens in a new tab)
Download worksheet 2 (opens in a new tab)
Worksheet included with VST Teacher Membership
-

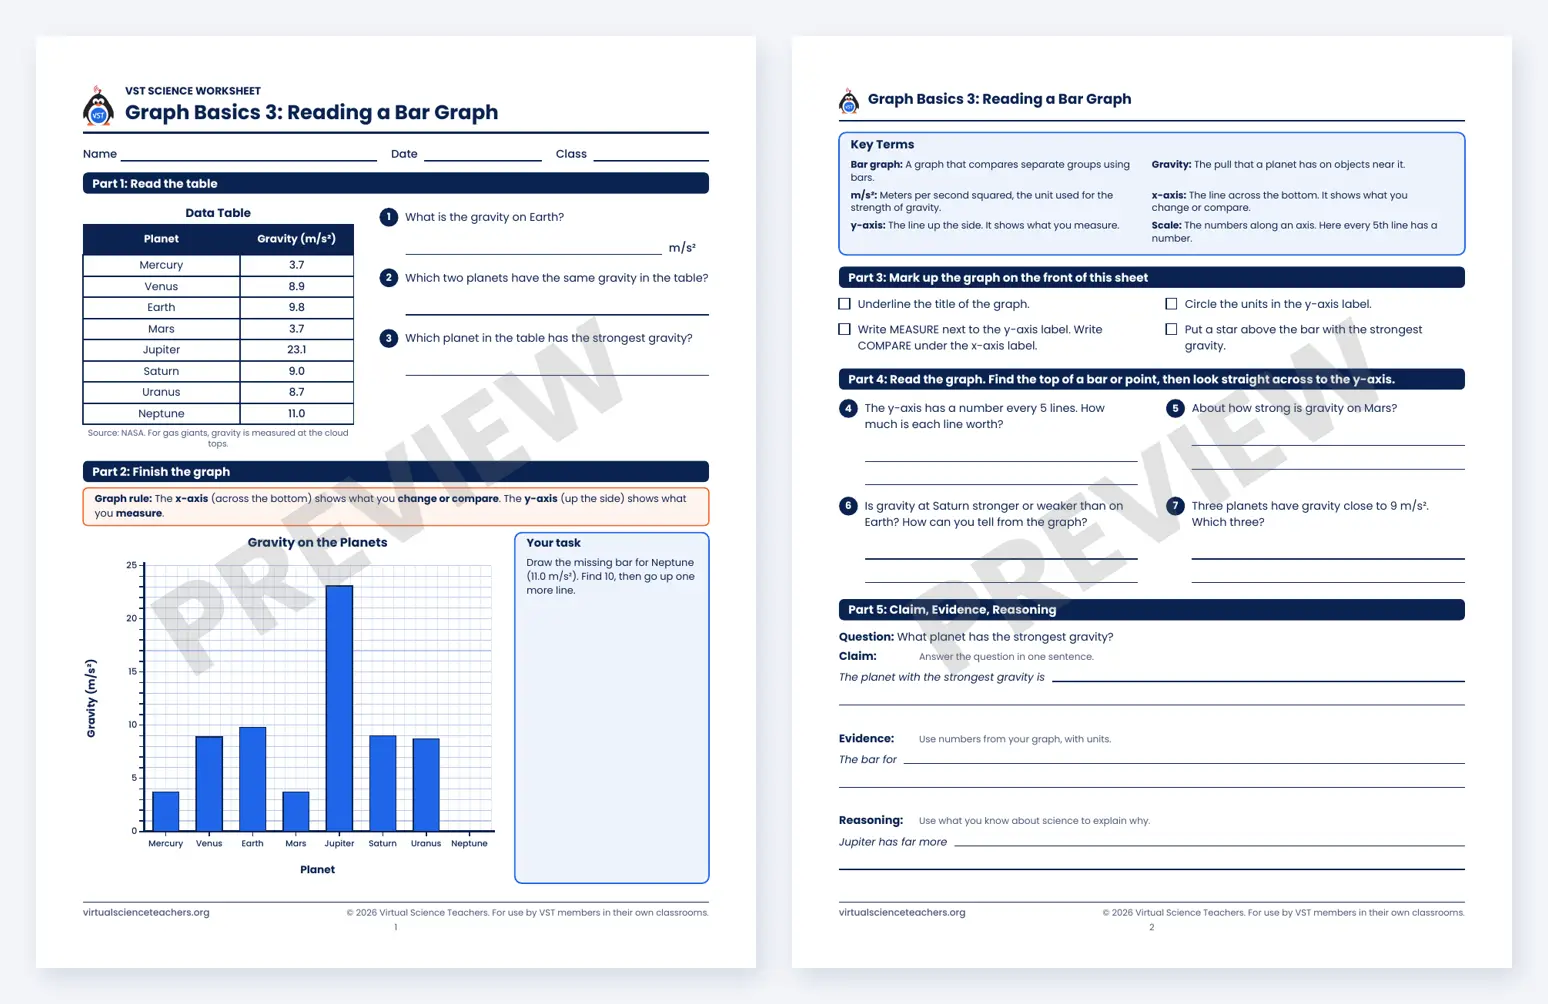
Activity 3 · Read a bar graph
Reading a Bar Graph
Read a finished bar graph, add a missing bar, and compare values.
Data: Planet gravity
 Preview worksheet 3 (opens in a new tab)
Download worksheet 3 (opens in a new tab)
Worksheet included with VST Teacher Membership
-

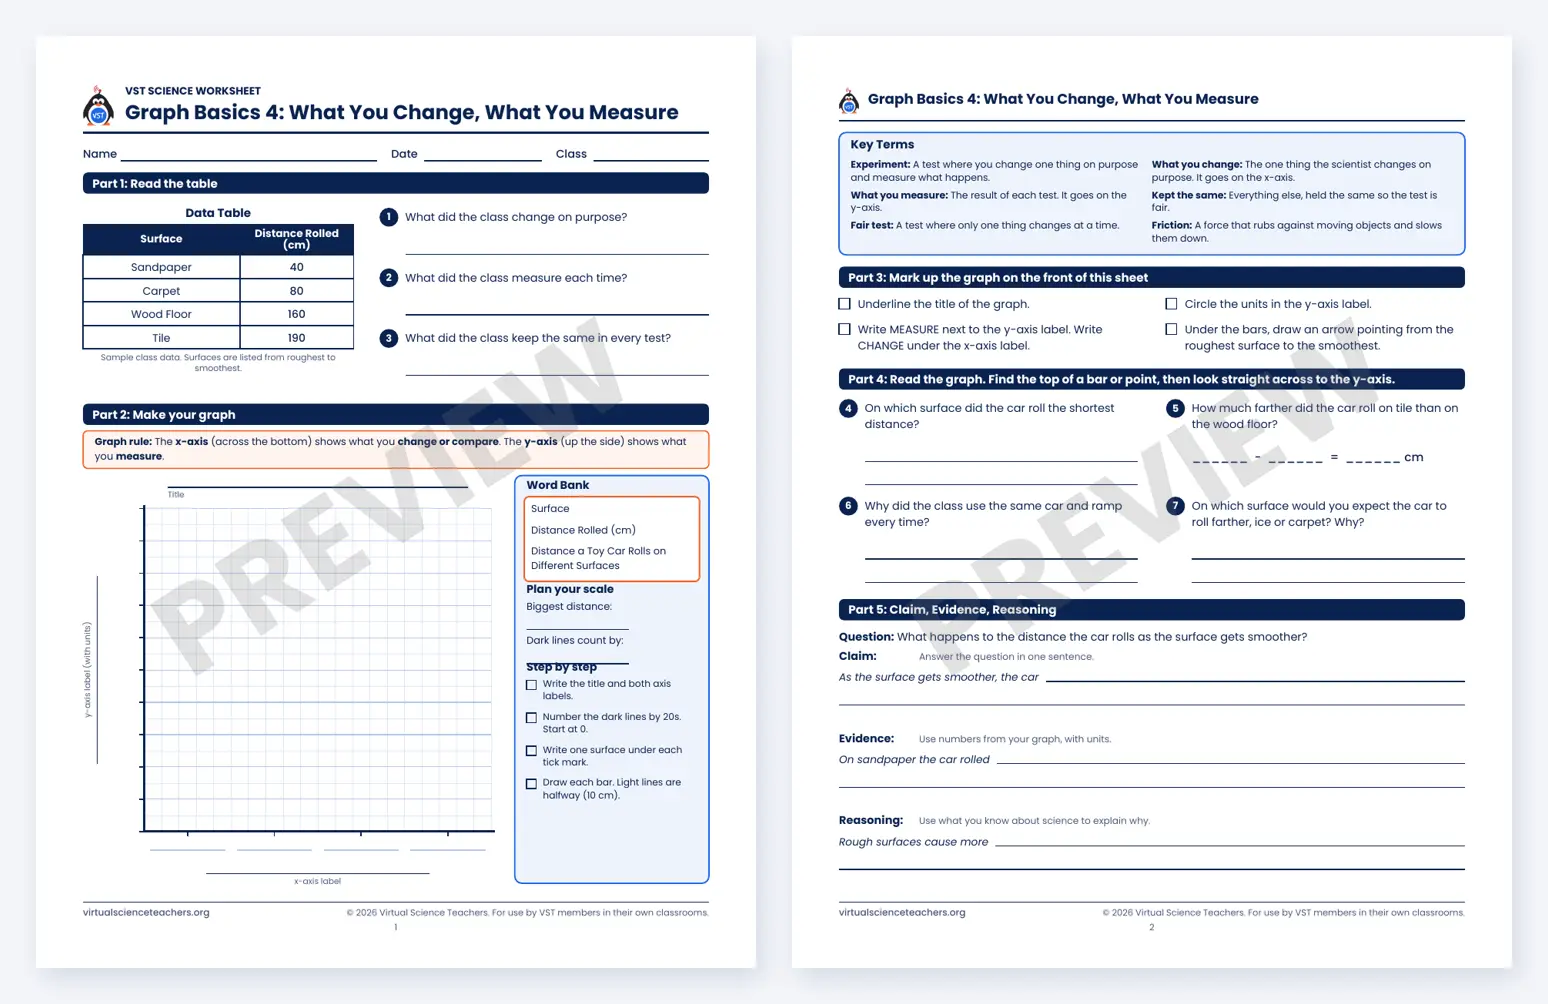
Activity 4 · Variables
What You Change, What You Measure
Find what you change, what you measure, and what you keep the same.
Data: Toy car on different surfaces
 Preview worksheet 4 (opens in a new tab)
Download worksheet 4 (opens in a new tab)
Worksheet included with VST Teacher Membership
-

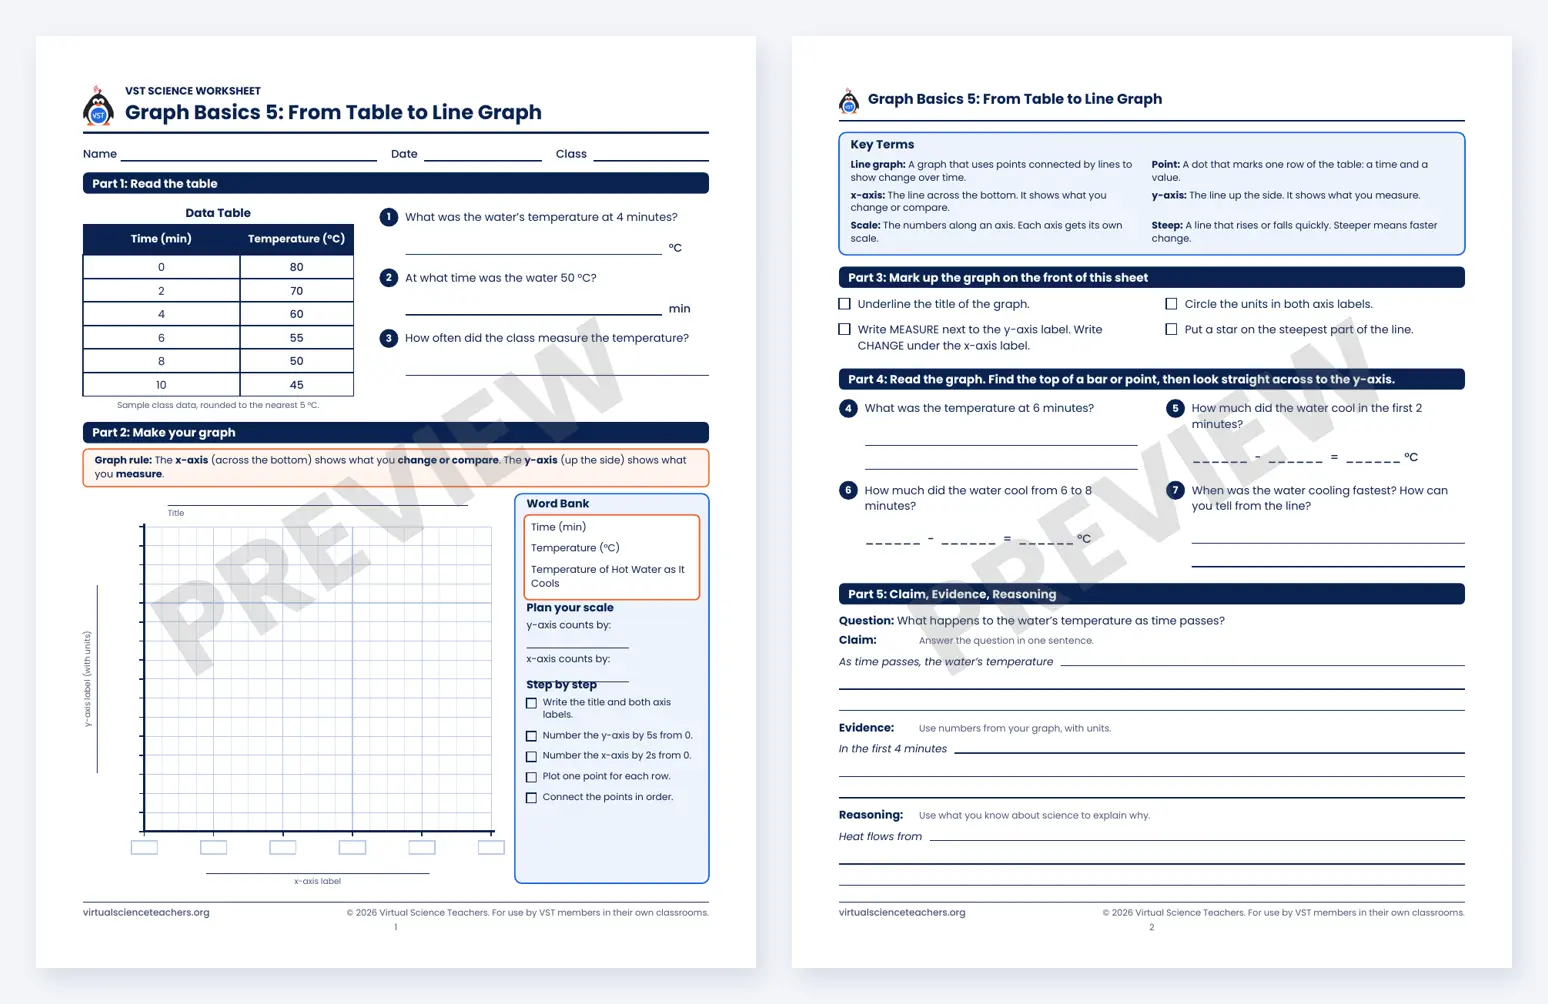
Activity 5 · Make a line graph
From Table to Line Graph
Number both axes, plot points, and connect them to show change over time.
Data: Hot water cooling
 Preview worksheet 5 (opens in a new tab)
Download worksheet 5 (opens in a new tab)
Worksheet included with VST Teacher Membership
-

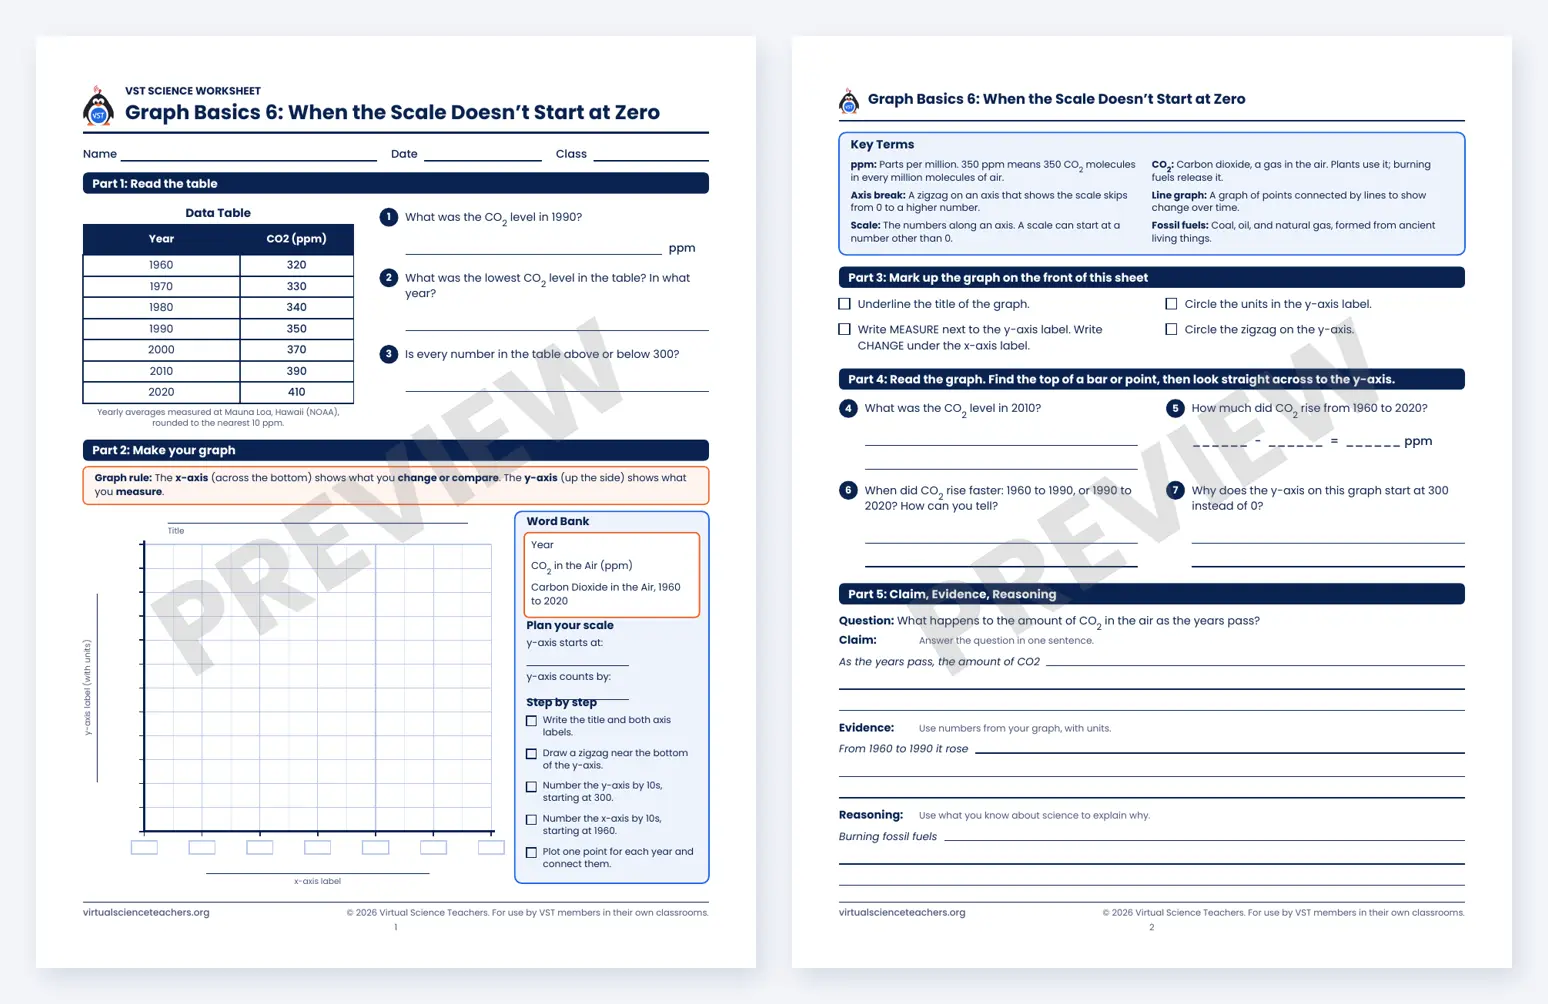
Activity 6 · Broken axis
When the Scale Doesn’t Start at Zero
Start the y-axis above zero and mark the jump with a zigzag.
Data: Carbon dioxide in the air
 Preview worksheet 6 (opens in a new tab)
Download worksheet 6 (opens in a new tab)
Worksheet included with VST Teacher Membership
-

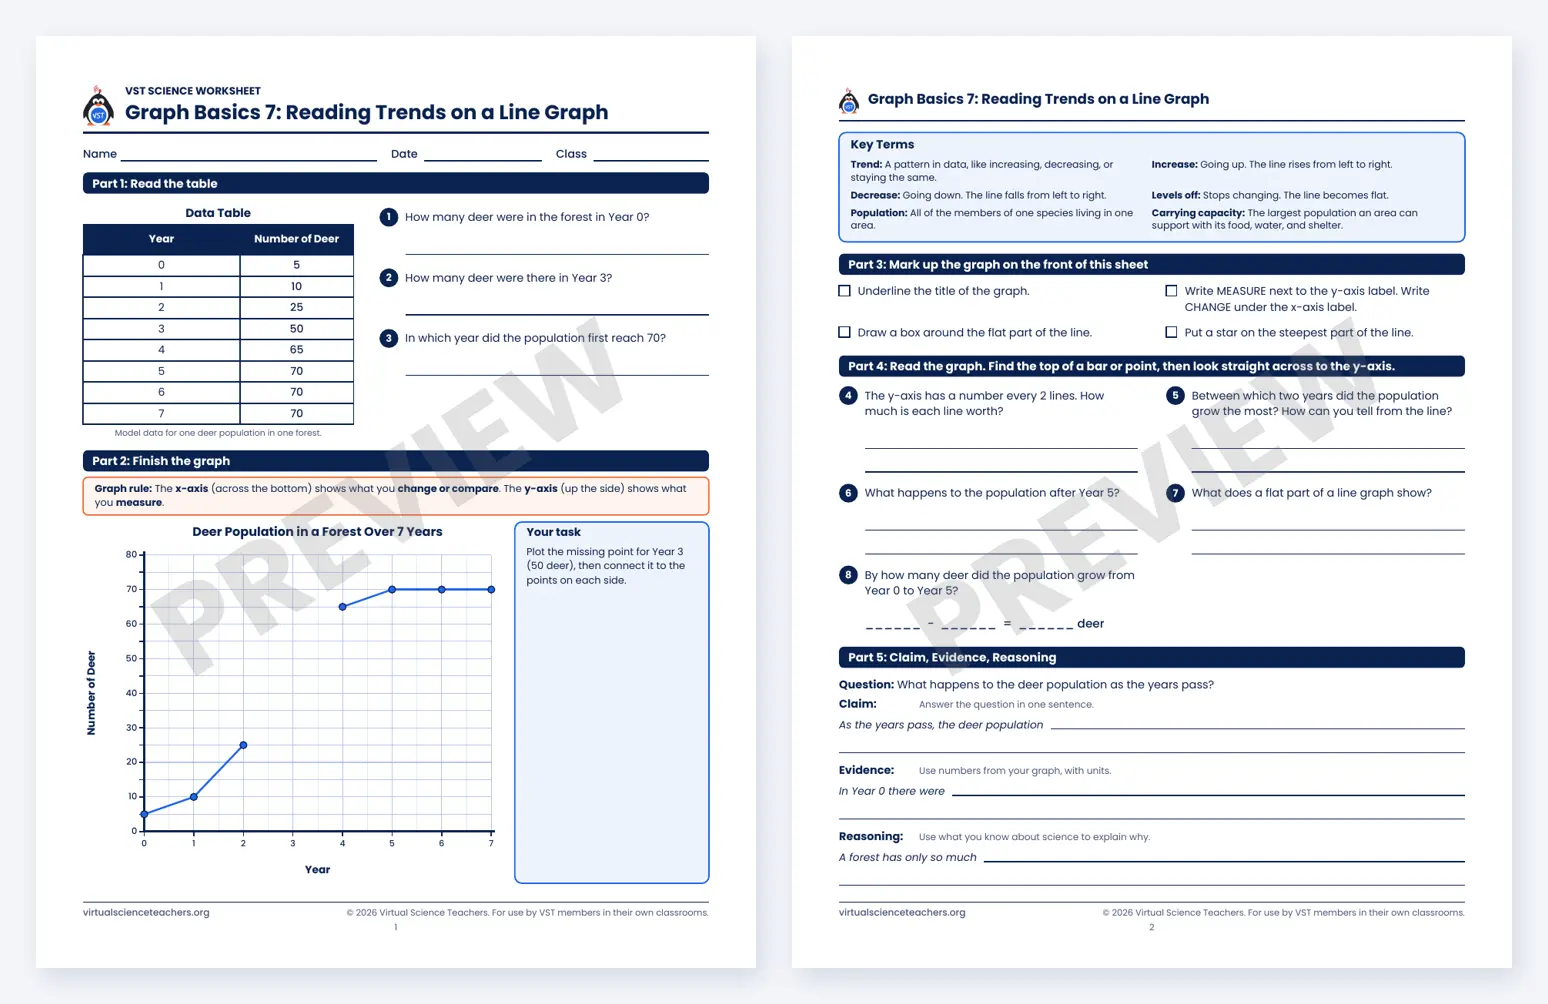
Activity 7 · Read trends
Reading Trends on a Line Graph
Spot increases, fastest growth, and where a line levels off.
Data: Deer population
 Preview worksheet 7 (opens in a new tab)
Download worksheet 7 (opens in a new tab)
Worksheet included with VST Teacher Membership
-

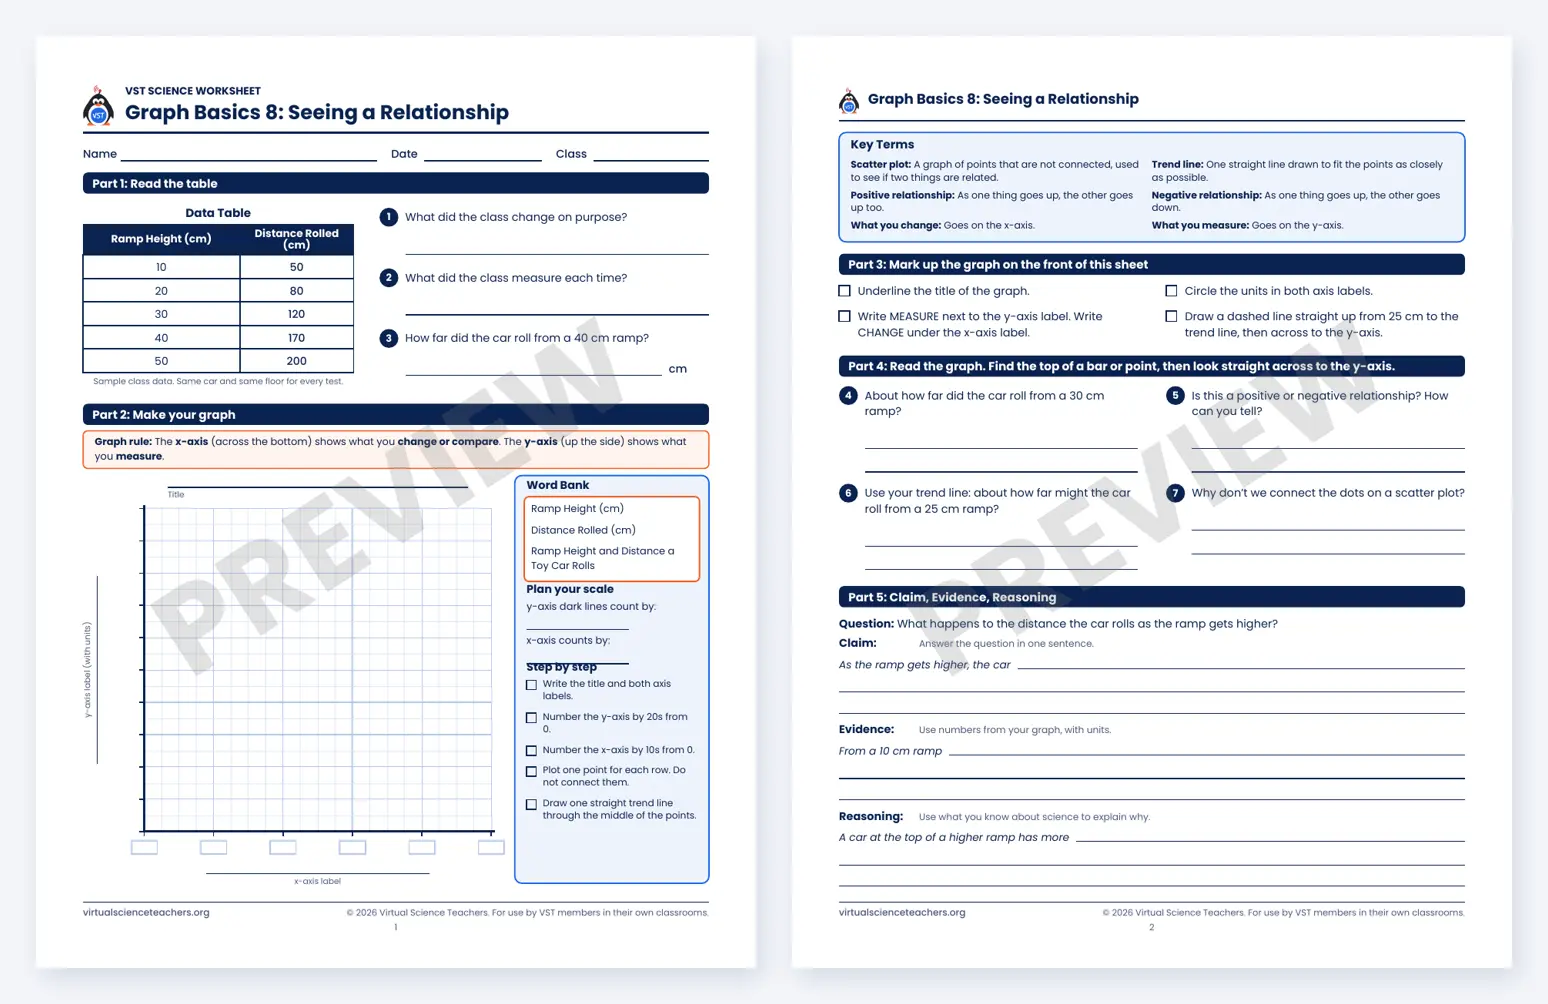
Activity 8 · Scatter plot and trend line
Seeing a Relationship
Make a scatter plot, add a trend line, and estimate between points.
Data: Ramp height and distance
 Preview worksheet 8 (opens in a new tab)
Download worksheet 8 (opens in a new tab)
Worksheet included with VST Teacher Membership
-

Activity 9 · Choose a graph type
Bar or Line?
Decide when to use a bar graph and when to use a line graph.
Data: Temperature during the school day
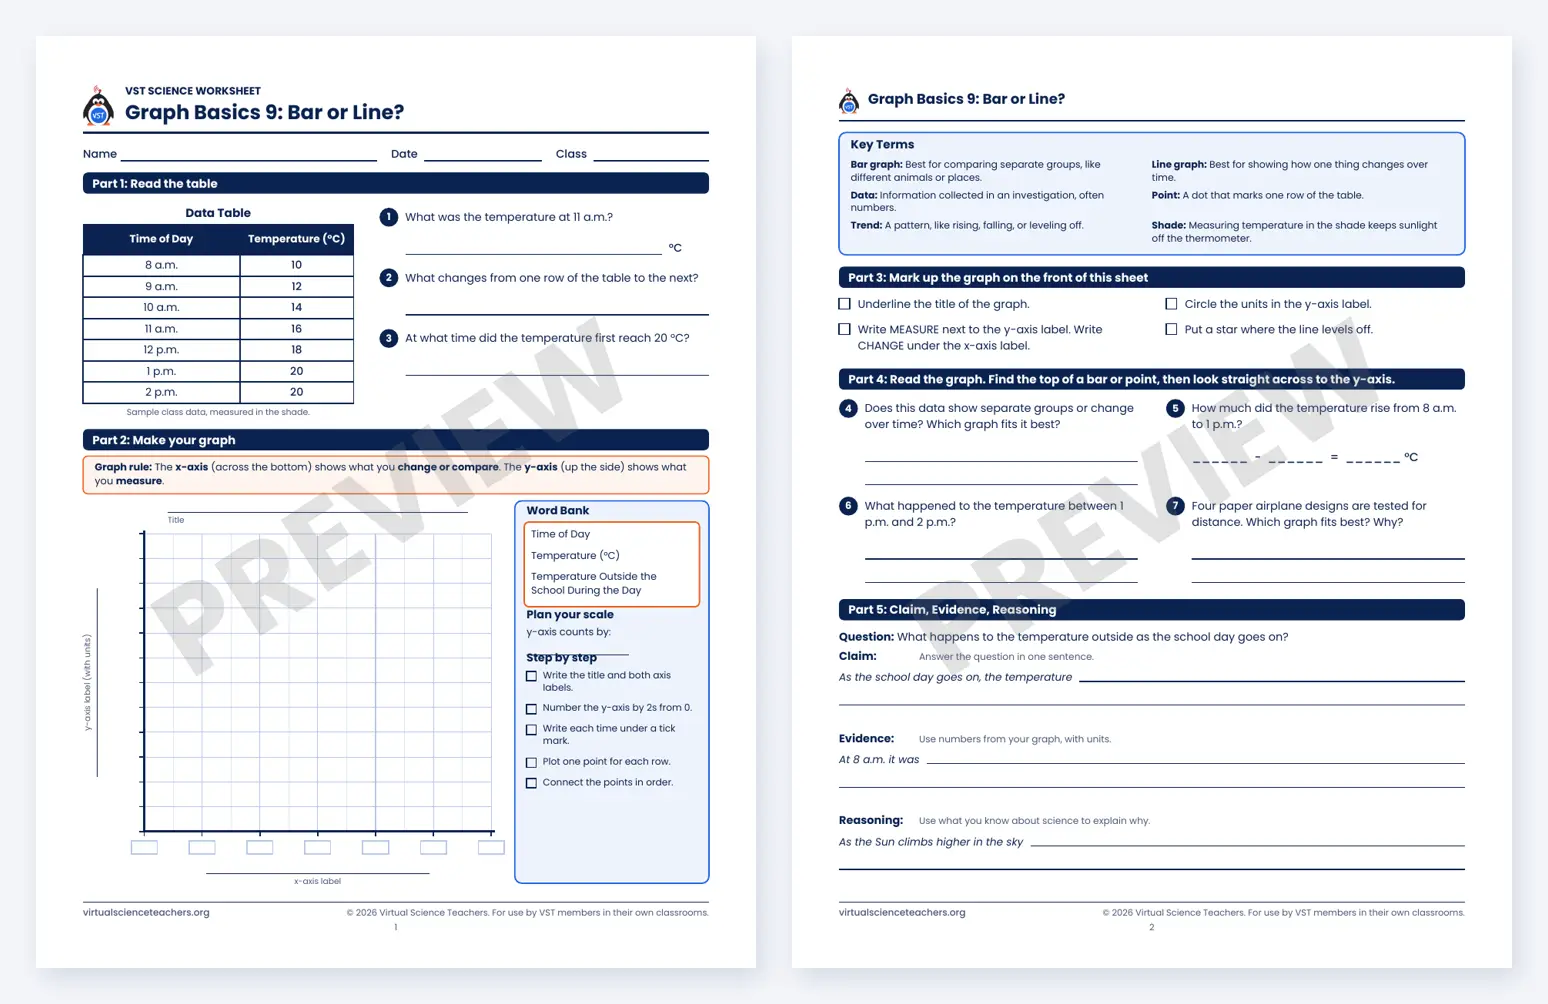 Preview worksheet 9 (opens in a new tab)
Download worksheet 9 (opens in a new tab)
Worksheet included with VST Teacher Membership
-

Activity 10 · Find graph mistakes
Graph Detective
Find and fix four common graph mistakes.
Data: Boiling points
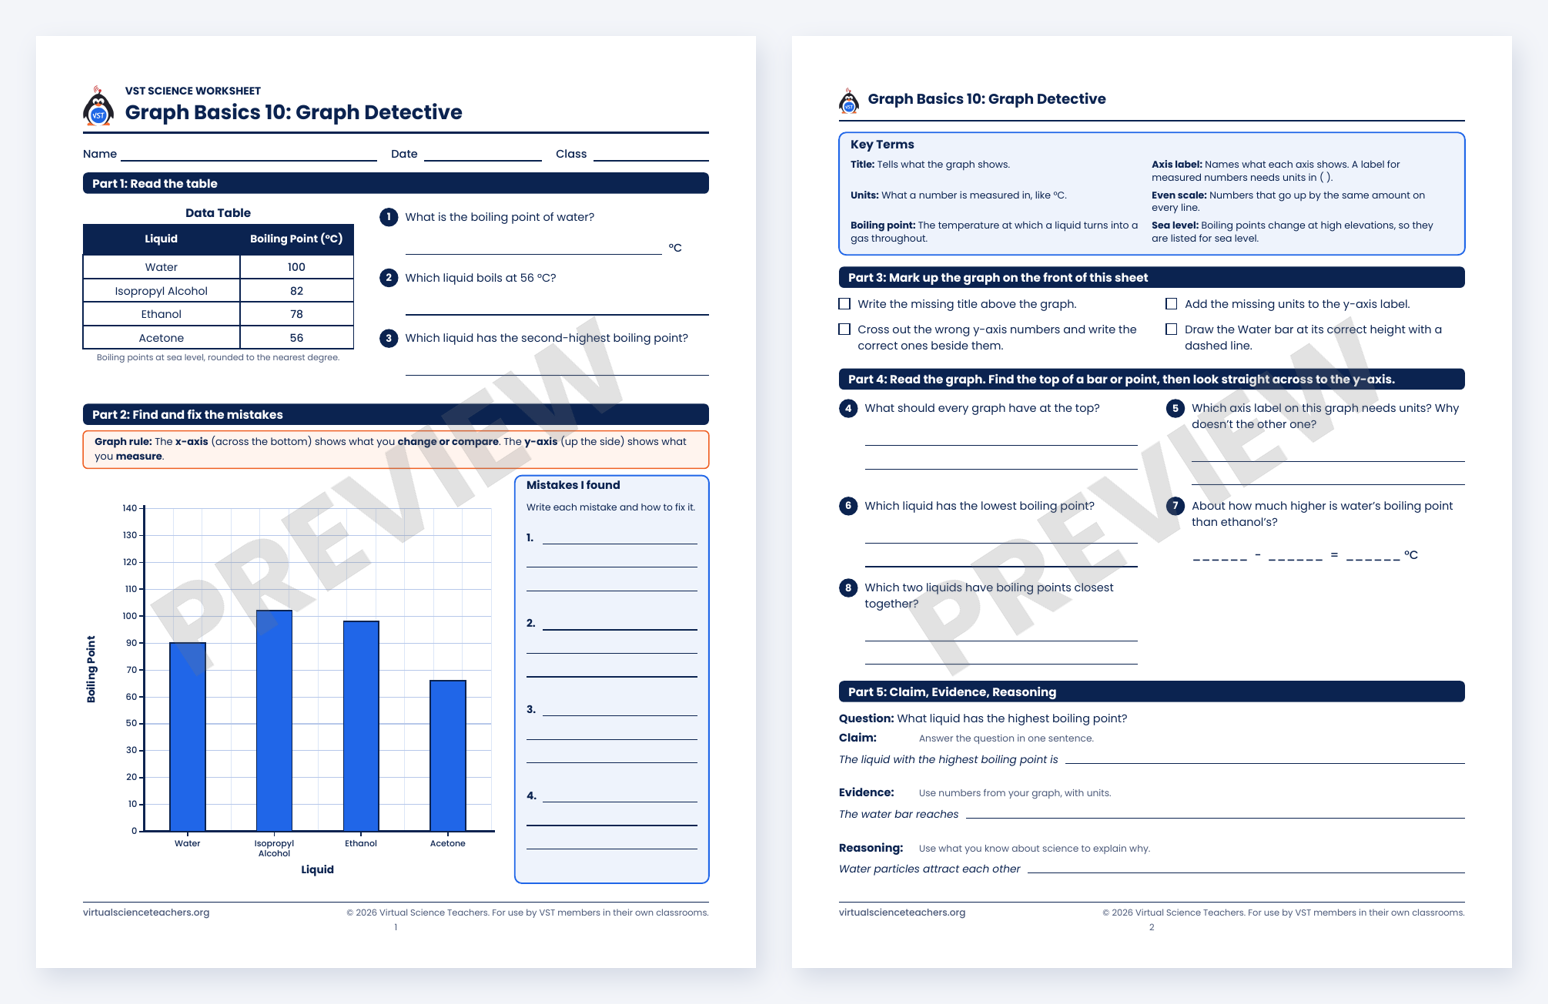 Preview worksheet 10 (opens in a new tab)
Download worksheet 10 (opens in a new tab)
Worksheet included with VST Teacher Membership
For teachers
Ways to use the set
- Mini-unit: one activity a day for two weeks, in order.
- Bell ringers: each activity fits in about 10 to 15 minutes.
- Before a lab: use Activities 4, 5, and 9 to prepare students to graph their own data.
- Practice and review: pair an activity with its worksheet for independent work or homework.
- Share a link: select Copy link on any card and paste it into your learning platform.
Standards connections
NGSS science practices
- SEP-4 Analyze and interpret data to recognize patterns and support explanations. Practice support, not a standalone performance expectation.
- SEP-5 Use mathematics and computational thinking to represent relationships and solve problems. Practice support, not a standalone performance expectation.
Virginia SOL
- 6.1c (Grade 6) interpreting, analyzing, and evaluating data
- LS.1c (Life Science) interpreting, analyzing, and evaluating data
- PS.1c (Physical Science) interpreting, analyzing, and evaluating data
Texas TEKS
- 6.2B (Grade 6) analyze data by identifying any significant descriptive statistical features, patterns, sources of error, or limitations
- 7.2B (Grade 7) analyze data by identifying any significant descriptive statistical features, patterns, sources of error, or limitations
- 8.2B (Grade 8) analyze data by identifying any significant descriptive statistical features, patterns, sources of error, or limitations
Supporting science-practice connections; select an activity for the specific skill. These introductory tasks do not cover full performance expectations.