Background Information
Ocean water levels change throughout the day because of tides. Tides are caused mainly by the gravitational pull of the Moon, and to a lesser extent, the Sun. As Earth rotates, different locations move into and out of areas where the ocean water is pulled higher or lower, creating high tides and low tides.
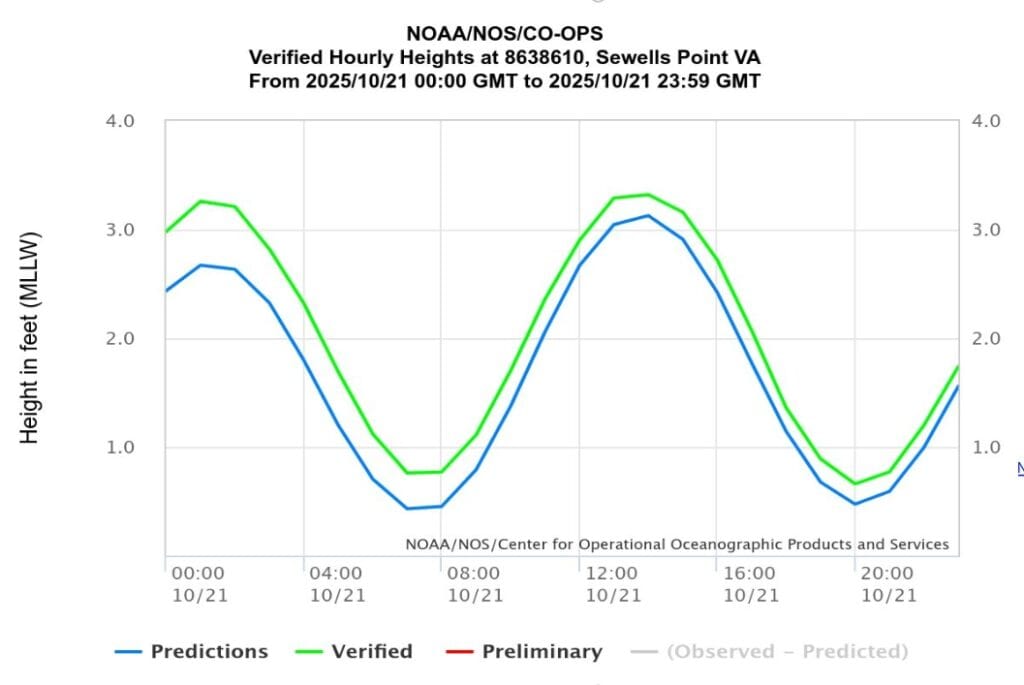
This graph shows hourly water heights at Sewells Point, Virginia, measured in feet over a single day. The data includes:
Predicted tide heights (based on tide models)
Verified tide heights (actual measurements recorded by instruments)
Comparing predicted and verified data helps scientists check how accurate tide models are and understand how real conditions, such as weather or wind, can affect water levels.
CER Question
Use Claim, Evidence, and Reasoning (CER) to explain how many high tides and low tides occurred on October 21, 2025.
Claim
State how many high tides and how many low tides occurred on October 21, 2025, based on the graph.
Evidence
Use specific information from the graph to support your claim.
Include:
Approximate times of day
Approximate tide heights (in feet)
Reasoning
Explain why the tides follow this repeating pattern.In your explanation:
Describe how the Moon’s gravity pulls on Earth’s oceans
Explain how Earth’s rotation causes locations to move through areas of higher and lower water levels
Additional Questions
About how many high tides and low tides occur during this one-day period?
At what time does the highest tide occur, and about how high is it?
At what time does the lowest tide occur, and about how low is it?
Do the predicted and verified lines follow the same general pattern throughout the day? How can you tell?
Why do you think scientists collect hourly data instead of measuring the tide only once or twice a day?
Embed This Graph of the Week
Copy and paste this code into your LMS or website (Canvas, Google Sites, etc.).