Background Information
Sound is made by vibrations. The speed of these vibrations is called frequency and is measured in hertz (Hz).
Higher frequency means faster vibrations and produces a higher-pitched sound.
Lower frequency means slower vibrations and produces a lower-pitched sound.
Different musical instruments produce different frequency ranges because of their size and design. In general, larger instruments have longer vibrating parts and vibrate more slowly, which creates lower-frequency sounds. Smaller instruments vibrate faster and can produce higher-frequency sounds. Most instruments can produce a range of frequencies, not just one sound.
CER Question
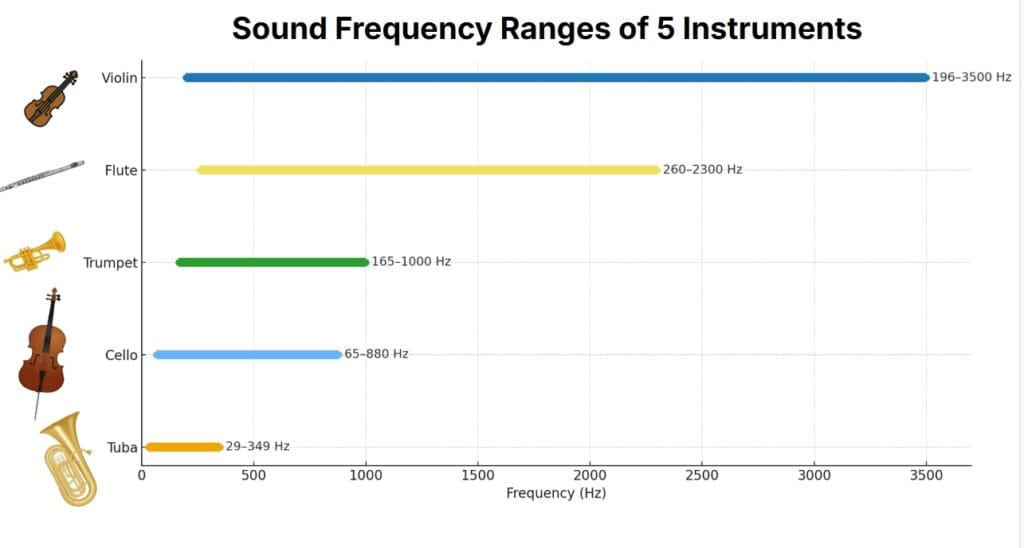
Which instrument on the graph can produce the highest-pitched sounds, and which instrument can produce the lowest-pitched sounds?
Claim
Make a claim naming the instrument that produces the highest frequencies and the instrument that produces the lowest frequencies.
Evidence
Use specific data from the graph to support your claim.
Include frequency values with units (Hz).
Reasoning
Explain why these frequency ranges make sense for the instruments shown.
In your explanation:
Connect frequency to pitch
Describe how the size of the instrument affects the sounds it produces
Explain why larger instruments usually produce lower-frequency sounds and smaller instruments usually produce higher-frequency sounds
Additional Questions
Which instrument has the widest frequency range? How can you tell from the graph?
Which two instruments have the most overlap in their frequency ranges? Use the graph to support your answer.
If a song uses notes around 800 Hz, which instruments could play those notes? Which instruments could not?
Compare the cello and the trumpet. Which one can play lower notes? Which one can play higher notes? Use evidence from the graph.
A student says, “The flute always plays higher sounds than the violin.” Use the graph to decide whether this is true or false and explain your reasoning.
Embed This Graph of the Week
Copy and paste this code into your LMS or website (Canvas, Google Sites, etc.).